
📊🧠 Analysis of Bitcoin market psychology based on quarterly data and historical price behavior
📊🧠 Analysis of Bitcoin market psychology based on quarterly data and historical price behavior
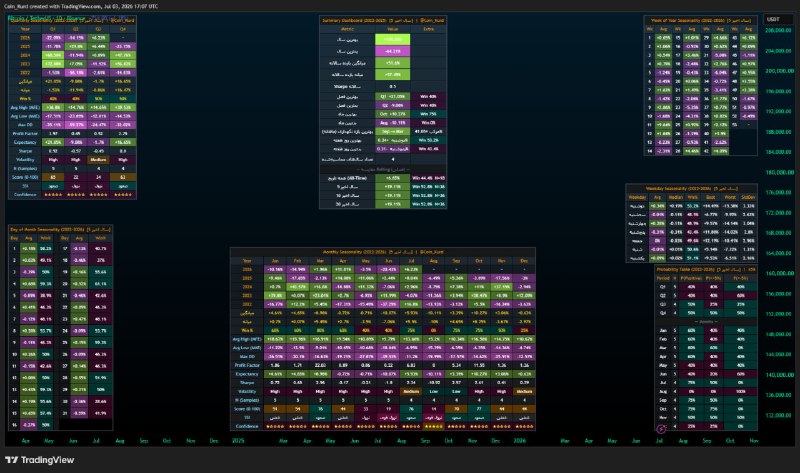
Financial markets do not move only on news, technical analysis or economic indicators; rather, a large part of their volatility is the result of investors' collective behavior. In addition to showing Bitcoin's statistical performance, the data in this dashboard also offer a picture of how traders' sentiment and psychology change over the course of the year.
🔹 First quarter (Q1): the return of hope
The year usually begins with a wave of optimism. After the end of the calendar year, investors enter the market with new capital and greater motivation. This has made the average return of the first quarter positive. Although the success rate is only 40%, when the market enters an uptrend, buyers' strength is so great that it makes up for the losses of the negative periods. This behavior shows the dominance of the feeling of “hope” over the market.
🔻 Second quarter (Q2): fading excitement and rising doubt
After the gains at the start of the year, many investors lock in their profits. At this point, the fear of losing profits (Fear of Giving Back Profits) replaces the excitement of buying. The result of this change in mindset is greater selling pressure and a negative average return for this quarter. During this period, the market is driven more by caution and conservatism.
⚖️ Third quarter (Q3): indecision and waiting
The third quarter is usually a period in which the market swings between hope and fear. Buyers do not have enough confidence to start a strong uptrend, nor do sellers find the strength to cause a deep drop. This situation keeps prices moving mostly in corrective or neutral phases. Psychologically, this period can be called the “waiting period”; a time when traders are waiting for a strong catalyst to make decisions.
🚀 Fourth quarter (Q4): the return of confidence and FOMO
Statistics show that the fourth quarter is one of Bitcoin's strongest periods. At this point, if an uptrend has formed, the feeling of “fear of missing out” (FOMO) grows among traders. New investors enter the market, and long-time investors are also less inclined to sell. This in turn strengthens uptrends and raises the average return.
📅 Psychological behavior in different months
✅ March and October are among the best months statistically. This shows that during these periods traders' confidence in the market was higher and liquidity inflows also increased.
❌ June and August have recorded the weakest performance. These months usually come with lower trading volume, falling liquidity and more conservative behavior. Many traders prefer to take on less risk during this period, and this in turn increases selling pressure.
📈 Days of the week and traders' behavior
The data show that Monday and Wednesday have performed better. From a psychological perspective, the start of the week usually comes with investors' fresh decisions and the arrival of new orders. In contrast, as the end of the week approaches, some traders close their positions to reduce risk, and the market trades with greater caution.
💡 The main message of this data
These statistics show that the Bitcoin market does not move on numbers alone; emotions such as hope, fear, greed, caution and FOMO play a prominent role in shaping trends. When collective optimism rises, big gains are recorded even with a low win rate. In contrast, when fear dominates the market, selling pressure can turn the average return negative for weeks or even months.
🎯 Summary
The data in this dashboard are a reminder of one important point: time cycles are in fact a reflection of investors' psychological cycles. Recognizing these patterns does not mean predicting the future with certainty, but it can help traders better understand the market's prevailing emotions, distance themselves from emotional decisions and base their trades on probability and risk management.
#market_psychology #Bitcoin #behavioral_analysis #crypto
Financial markets do not move only on news, technical analysis or economic indicators; rather, a large part of their volatility is the result of investors' collective behavior. In addition to showing Bitcoin's statistical performance, the data in this dashboard also offer a picture of how traders' sentiment and psychology change over the course of the year.
🔹 First quarter (Q1): the return of hope
The year usually begins with a wave of optimism. After the end of the calendar year, investors enter the market with new capital and greater motivation. This has made the average return of the first quarter positive. Although the success rate is only 40%, when the market enters an uptrend, buyers' strength is so great that it makes up for the losses of the negative periods. This behavior shows the dominance of the feeling of “hope” over the market.
🔻 Second quarter (Q2): fading excitement and rising doubt
After the gains at the start of the year, many investors lock in their profits. At this point, the fear of losing profits (Fear of Giving Back Profits) replaces the excitement of buying. The result of this change in mindset is greater selling pressure and a negative average return for this quarter. During this period, the market is driven more by caution and conservatism.
⚖️ Third quarter (Q3): indecision and waiting
The third quarter is usually a period in which the market swings between hope and fear. Buyers do not have enough confidence to start a strong uptrend, nor do sellers find the strength to cause a deep drop. This situation keeps prices moving mostly in corrective or neutral phases. Psychologically, this period can be called the “waiting period”; a time when traders are waiting for a strong catalyst to make decisions.
🚀 Fourth quarter (Q4): the return of confidence and FOMO
Statistics show that the fourth quarter is one of Bitcoin's strongest periods. At this point, if an uptrend has formed, the feeling of “fear of missing out” (FOMO) grows among traders. New investors enter the market, and long-time investors are also less inclined to sell. This in turn strengthens uptrends and raises the average return.
📅 Psychological behavior in different months
✅ March and October are among the best months statistically. This shows that during these periods traders' confidence in the market was higher and liquidity inflows also increased.
❌ June and August have recorded the weakest performance. These months usually come with lower trading volume, falling liquidity and more conservative behavior. Many traders prefer to take on less risk during this period, and this in turn increases selling pressure.
📈 Days of the week and traders' behavior
The data show that Monday and Wednesday have performed better. From a psychological perspective, the start of the week usually comes with investors' fresh decisions and the arrival of new orders. In contrast, as the end of the week approaches, some traders close their positions to reduce risk, and the market trades with greater caution.
💡 The main message of this data
These statistics show that the Bitcoin market does not move on numbers alone; emotions such as hope, fear, greed, caution and FOMO play a prominent role in shaping trends. When collective optimism rises, big gains are recorded even with a low win rate. In contrast, when fear dominates the market, selling pressure can turn the average return negative for weeks or even months.
🎯 Summary
The data in this dashboard are a reminder of one important point: time cycles are in fact a reflection of investors' psychological cycles. Recognizing these patterns does not mean predicting the future with certainty, but it can help traders better understand the market's prevailing emotions, distance themselves from emotional decisions and base their trades on probability and risk management.
#market_psychology #Bitcoin #behavioral_analysis #crypto
Persian original · View this post on Telegram ↗ · Open in the archive · 💬 Discuss in the Coin_Kurd Telegram group · Educational, not financial advice.