
📘 Comprehensive guide to the Kurdistani Market Cycle indicator (Part 1)
📘 Comprehensive guide to the Kurdistani Market Cycle indicator (Part 1)
🔥 Why is this indicator different from most indicators?
If you have been active in financial markets for a while, you have probably faced the problem that each indicator shows only one part of the market; one shows the trend, another momentum, one examines volume and another indicator analyses market structure.
The result is a cluttered chart and harder decision-making.
The Kurdistani Market Cycle indicator was designed precisely to solve this very problem. This tool brings several important concepts of technical analysis and Smart Money together in a single integrated system, so that the trader can have a more complete picture of the market’s condition without using several different indicators.
--- 🎯 The indicator’s main goal
This indicator is not only about generating buy and sell signals.
Its main goal is to answer a few important questions:
✅ What stage of its cycle is the market in right now?
✅ How strong is the trend?
✅ Are buyers in control of the market, or sellers?
✅ Is liquidity being accumulated?
✅ Is the current trend likely to continue, or is it on the verge of changing?
That is why this indicator is considered more a market analysis system than a simple indicator.
--- ⚙️ The indicator’s core: CMO
The heart of this indicator is built on CMO, or the Chande Momentum Oscillator.
CMO is one of the most accurate momentum oscillators, measuring the difference in strength between buyers and sellers.
Unlike RSI, which mostly shows the degree of overbought and oversold conditions, CMO directly examines the real strength of price movement.
In simple terms:
📈 If buyers are stronger, the CMO value becomes positive.
📉 If sellers are stronger, its value will be negative.
The closer the CMO value gets to either end of the range, the more it shows that the market has entered one of its emotional phases.
--- 🧠 But what is different about the Kurdistani Market Cycle version?
This version does not use CMO alone.
The developer has added multiple layers of professional analysis on top of it, including:
🔹 Trend analysis
🔹 Trading volume analysis
🔹 Market structure detection (Market Structure)
🔹 Smart Money concepts
🔹 Liquidity analysis
🔹 Divergences
🔹 Order Block
🔹 Fair Value Gap
🔹 Smart scoring engine
That is why the final output will be far more accurate than an ordinary oscillator.
--- 📊 Main components of the indicator
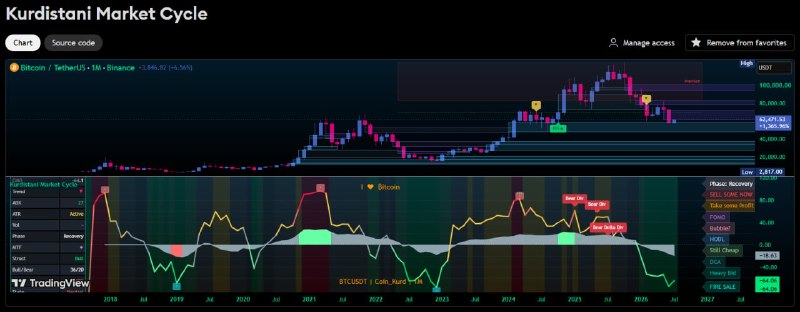
After adding the indicator to the chart, you will see several different sections, each with a specific task.
🌈 1. Main CMO chart
The most important part of the indicator is the coloured CMO line.
This line shows the strength and direction of market movement, and its colour changes depending on market conditions.
Each colour represents a different state of the market cycle.
--- 🎨 2. Coloured background (Heatmap)
One of the indicator’s most attractive features is its background colouring.
This section helps the trader understand the overall state of the market just by looking at the colours, without needing to examine numbers.
In fact, the background colour represents the current stage of the market cycle.
--- 📍 3. Momentum structure
The indicator automatically identifies the important highs and lows of the CMO and, using labels such as:
🔺 HH
🔹 HL
🔻 LH
🔸 LL
displays them.
This structure shows whether the strength of market movement is increasing or decreasing.
--- 📉 4. Divergences
One of the most important features of this indicator is the automatic detection of divergence between price and CMO.
This feature can give the trader very valuable warnings before a trend change.
--- 💎 5. Smart Money tools
Unlike many oscillators, this indicator also draws important information directly on the price chart.
Including:
✅ Order Block
✅ Fair Value Gap
✅ Liquidity Sweep
✅ BOS
✅ MSS
✅ Premium & Discount Zones
As a result, the trader will see all the important Smart Money concepts on the chart without needing additional tools.
--- 📊 6. Information dashboard
A complete dashboard is displayed in the corner of the chart, summarising the real-time state of the market.
This dashboard displays information such as:
📈 Trend
⚡️ Momentum strength
🔥 Volume
📊 Buy score
📉 Sell score
🎯 Signal quality
and much other important information.
--- 💡 Why has this indicator become popular?
Because instead of focusing on a single factor, it examines several different parts of the market at the same time.
#gift_indicator #TradingView #smart_money #Bitcoin
🔥 Why is this indicator different from most indicators?
If you have been active in financial markets for a while, you have probably faced the problem that each indicator shows only one part of the market; one shows the trend, another momentum, one examines volume and another indicator analyses market structure.
The result is a cluttered chart and harder decision-making.
The Kurdistani Market Cycle indicator was designed precisely to solve this very problem. This tool brings several important concepts of technical analysis and Smart Money together in a single integrated system, so that the trader can have a more complete picture of the market’s condition without using several different indicators.
--- 🎯 The indicator’s main goal
This indicator is not only about generating buy and sell signals.
Its main goal is to answer a few important questions:
✅ What stage of its cycle is the market in right now?
✅ How strong is the trend?
✅ Are buyers in control of the market, or sellers?
✅ Is liquidity being accumulated?
✅ Is the current trend likely to continue, or is it on the verge of changing?
That is why this indicator is considered more a market analysis system than a simple indicator.
--- ⚙️ The indicator’s core: CMO
The heart of this indicator is built on CMO, or the Chande Momentum Oscillator.
CMO is one of the most accurate momentum oscillators, measuring the difference in strength between buyers and sellers.
Unlike RSI, which mostly shows the degree of overbought and oversold conditions, CMO directly examines the real strength of price movement.
In simple terms:
📈 If buyers are stronger, the CMO value becomes positive.
📉 If sellers are stronger, its value will be negative.
The closer the CMO value gets to either end of the range, the more it shows that the market has entered one of its emotional phases.
--- 🧠 But what is different about the Kurdistani Market Cycle version?
This version does not use CMO alone.
The developer has added multiple layers of professional analysis on top of it, including:
🔹 Trend analysis
🔹 Trading volume analysis
🔹 Market structure detection (Market Structure)
🔹 Smart Money concepts
🔹 Liquidity analysis
🔹 Divergences
🔹 Order Block
🔹 Fair Value Gap
🔹 Smart scoring engine
That is why the final output will be far more accurate than an ordinary oscillator.
--- 📊 Main components of the indicator
After adding the indicator to the chart, you will see several different sections, each with a specific task.
🌈 1. Main CMO chart
The most important part of the indicator is the coloured CMO line.
This line shows the strength and direction of market movement, and its colour changes depending on market conditions.
Each colour represents a different state of the market cycle.
--- 🎨 2. Coloured background (Heatmap)
One of the indicator’s most attractive features is its background colouring.
This section helps the trader understand the overall state of the market just by looking at the colours, without needing to examine numbers.
In fact, the background colour represents the current stage of the market cycle.
--- 📍 3. Momentum structure
The indicator automatically identifies the important highs and lows of the CMO and, using labels such as:
🔺 HH
🔹 HL
🔻 LH
🔸 LL
displays them.
This structure shows whether the strength of market movement is increasing or decreasing.
--- 📉 4. Divergences
One of the most important features of this indicator is the automatic detection of divergence between price and CMO.
This feature can give the trader very valuable warnings before a trend change.
--- 💎 5. Smart Money tools
Unlike many oscillators, this indicator also draws important information directly on the price chart.
Including:
✅ Order Block
✅ Fair Value Gap
✅ Liquidity Sweep
✅ BOS
✅ MSS
✅ Premium & Discount Zones
As a result, the trader will see all the important Smart Money concepts on the chart without needing additional tools.
--- 📊 6. Information dashboard
A complete dashboard is displayed in the corner of the chart, summarising the real-time state of the market.
This dashboard displays information such as:
📈 Trend
⚡️ Momentum strength
🔥 Volume
📊 Buy score
📉 Sell score
🎯 Signal quality
and much other important information.
--- 💡 Why has this indicator become popular?
Because instead of focusing on a single factor, it examines several different parts of the market at the same time.
#gift_indicator #TradingView #smart_money #Bitcoin
Persian original · View this post on Telegram ↗ · Open in the archive · 💬 Discuss in the Coin_Kurd Telegram group · Educational, not financial advice.