
# Logarithmic or Linear Scale? Why a Chart That Looks “Broken” Sometimes Never Broke at All
# Logarithmic or Linear Scale? Why a Chart That Looks “Broken” Sometimes Never Broke at All
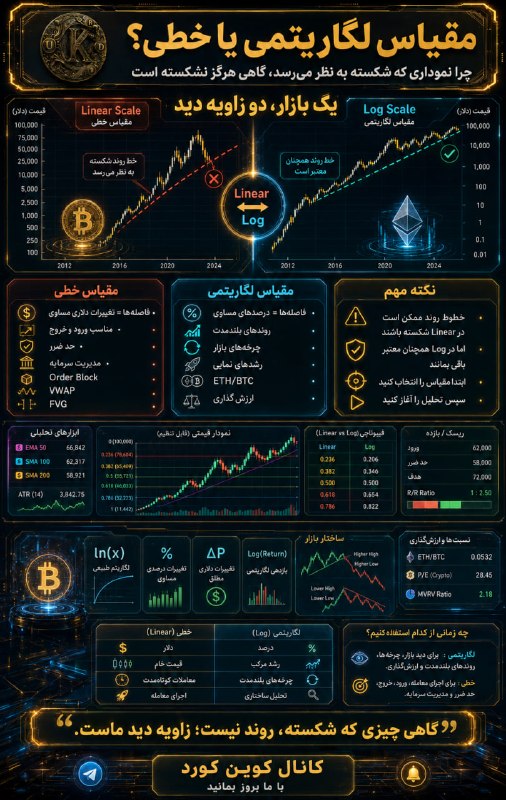
Most traders see the “Log” option next to “Linear” as just a cosmetic setting; something like changing the chart's color. But this choice doesn't change the appearance; it changes your point of view. The moment you change the scale, trendlines, Fibonacci levels, the shape of patterns and even backtest results can change. Not because the market has changed, but because your measuring instrument has changed.
All measurement starts with a simple question: “What do we assume to be equal?”
On a linear scale, equal distances on the price axis mean equal dollar changes. The distance from $10 to $20 takes up as much space as the distance from $110 to $120. The market pays no attention to percentage growth; it only sees the raw number.
But on a logarithmic scale, the story is different. Here, equal distances represent equal percentages. Growth from $10 to $20 takes up the same distance as growth from $100 to $200, because both mean one hundred percent growth. In this space, a straight line is no longer a sign of a constant price increase, but a sign of compound growth at a constant rate.
That is why the more exponential an asset's history, the more honest the picture a logarithmic chart gives of it.
The cryptocurrency market is a clear example of this difference. Over its lifetime, Bitcoin has multiplied several-fold again and again. If you view such a move only on a linear scale, the early years of the chart are compressed into a thin strip; as if what you see today had been the entire story of the market. Meanwhile, a large part of history is simply hidden under the weight of bigger numbers.
From this we can see that each scale has its own language.
When you want to read multi-year cycles, analyze weekly and monthly trends, examine ratios such as ETH/BTC, or look at an asset that has grown tenfold, a hundredfold or more, the logarithmic scale is the natural choice. Logarithmic regression models, diminishing-returns curves and many valuation tools are also built on this same logic.
This is where one of the most common analytical errors occurs. A trendline that looks broken on a linear chart may still be completely valid on a logarithmic chart. In every bullish cycle, we see traders declaring the end of a trend when they simply haven't changed the display scale. Sometimes what has broken is not the trend; it is our point of view.
By contrast, when it is time to execute—when you are about to enter a trade, set a stop loss, assess the risk-to-reward ratio, or work with liquidity zones, Order Blocks, FVGs and VWAP—the linear scale is the more precise tool. In limited price ranges, the difference between the two scales becomes so small that it almost disappears, and dollar measurements take on more practical meaning.
But the difference between the two is not limited to the appearance of the lines.
Fibonacci is a good example. Many assume that the 0.618 ratio is always the same 0.618. In fact, it is not. On a linear scale, this ratio is measured based on absolute price changes; on a logarithmic scale, based on percentage change. If an asset has grown five- or tenfold, the gap between the two can be large enough to change your trading decision. If your trading system is based on Fibonacci, the choice of scale must be part of the system itself, not a decision that changes in the middle of the analysis.
The same logic holds for moving averages. SMA and EMA are always calculated on raw price, not on the logarithm of price. When you see them on a logarithmic chart, the calculation has not changed; only the way it is displayed has. So the slope of a moving average should not be assumed to be the same as the slope of a trendline in logarithmic space.
The chart's geometry is not safe either. Triangles and channels depend on the coordinate system in which they are drawn. A pattern that looks like an ascending triangle on a linear scale may turn into a parallel channel on a logarithmic scale. Both interpretations cannot be correct at the same time. Before you interpret a pattern, you must decide which geometric world you are standing in.
From a statistical point of view, too, the market lives more in percentages than in dollars. Asset returns, especially in the cryptocurrency market, usually behave closer to a logarithmic distribution than to a normal one. That is why many risk management models use percentage ATR or the standard deviation of logarithmic returns, not raw price volatility. The logarithmic chart is simply a visual representation of this same reality.
https://discord.gg/dteRyM5xaH🅲🅾️🅸🅽 🅺🆄🆁🅳 👾Discord 🎥Youtube 📸Instagram 💬X
Most traders see the “Log” option next to “Linear” as just a cosmetic setting; something like changing the chart's color. But this choice doesn't change the appearance; it changes your point of view. The moment you change the scale, trendlines, Fibonacci levels, the shape of patterns and even backtest results can change. Not because the market has changed, but because your measuring instrument has changed.
All measurement starts with a simple question: “What do we assume to be equal?”
On a linear scale, equal distances on the price axis mean equal dollar changes. The distance from $10 to $20 takes up as much space as the distance from $110 to $120. The market pays no attention to percentage growth; it only sees the raw number.
But on a logarithmic scale, the story is different. Here, equal distances represent equal percentages. Growth from $10 to $20 takes up the same distance as growth from $100 to $200, because both mean one hundred percent growth. In this space, a straight line is no longer a sign of a constant price increase, but a sign of compound growth at a constant rate.
That is why the more exponential an asset's history, the more honest the picture a logarithmic chart gives of it.
The cryptocurrency market is a clear example of this difference. Over its lifetime, Bitcoin has multiplied several-fold again and again. If you view such a move only on a linear scale, the early years of the chart are compressed into a thin strip; as if what you see today had been the entire story of the market. Meanwhile, a large part of history is simply hidden under the weight of bigger numbers.
From this we can see that each scale has its own language.
When you want to read multi-year cycles, analyze weekly and monthly trends, examine ratios such as ETH/BTC, or look at an asset that has grown tenfold, a hundredfold or more, the logarithmic scale is the natural choice. Logarithmic regression models, diminishing-returns curves and many valuation tools are also built on this same logic.
This is where one of the most common analytical errors occurs. A trendline that looks broken on a linear chart may still be completely valid on a logarithmic chart. In every bullish cycle, we see traders declaring the end of a trend when they simply haven't changed the display scale. Sometimes what has broken is not the trend; it is our point of view.
By contrast, when it is time to execute—when you are about to enter a trade, set a stop loss, assess the risk-to-reward ratio, or work with liquidity zones, Order Blocks, FVGs and VWAP—the linear scale is the more precise tool. In limited price ranges, the difference between the two scales becomes so small that it almost disappears, and dollar measurements take on more practical meaning.
But the difference between the two is not limited to the appearance of the lines.
Fibonacci is a good example. Many assume that the 0.618 ratio is always the same 0.618. In fact, it is not. On a linear scale, this ratio is measured based on absolute price changes; on a logarithmic scale, based on percentage change. If an asset has grown five- or tenfold, the gap between the two can be large enough to change your trading decision. If your trading system is based on Fibonacci, the choice of scale must be part of the system itself, not a decision that changes in the middle of the analysis.
The same logic holds for moving averages. SMA and EMA are always calculated on raw price, not on the logarithm of price. When you see them on a logarithmic chart, the calculation has not changed; only the way it is displayed has. So the slope of a moving average should not be assumed to be the same as the slope of a trendline in logarithmic space.
The chart's geometry is not safe either. Triangles and channels depend on the coordinate system in which they are drawn. A pattern that looks like an ascending triangle on a linear scale may turn into a parallel channel on a logarithmic scale. Both interpretations cannot be correct at the same time. Before you interpret a pattern, you must decide which geometric world you are standing in.
From a statistical point of view, too, the market lives more in percentages than in dollars. Asset returns, especially in the cryptocurrency market, usually behave closer to a logarithmic distribution than to a normal one. That is why many risk management models use percentage ATR or the standard deviation of logarithmic returns, not raw price volatility. The logarithmic chart is simply a visual representation of this same reality.
https://discord.gg/dteRyM5xaH🅲🅾️🅸🅽 🅺🆄🆁🅳 👾Discord 🎥Youtube 📸Instagram 💬X
Persian original · View this post on Telegram ↗ · Open in the archive · 💬 Discuss in the Coin_Kurd Telegram group · Educational, not financial advice.