
Introducing the Kurdistani Bitcoin Power Law indicator
Introducing the Kurdistani Bitcoin Power Law indicator
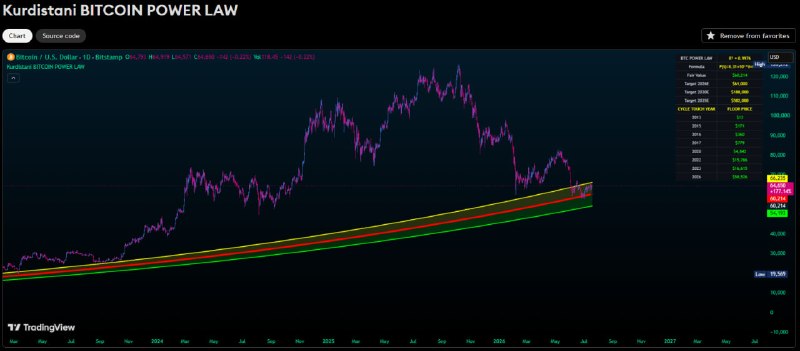
The Kurdistani Bitcoin Power Law indicator is an advanced, long-term tool for the macro analysis of Bitcoin, developed with version 6 of Pine Script (Pine Script v6). This tool simulates the historical growth path of Bitcoin's price based on the mathematical “Power Law” model. In this model, time is treated as a logical, diminishing growth factor in order to prevent an unrealistic price explosion in the long run.
By plotting the “fair value” alongside deviation bands, this indicator helps investors identify tops, bottoms and long-term accumulation zones.
🔬 The model's mathematical calculations
This indicator calculates the number of days elapsed since Bitcoin's genesis block (January 3, 2009) and uses the following regression formula with an extremely high correlation coefficient ($R^2 = 0.9976$):
$$P(t) = 8.31 \times 10^{-17} \times t^{5.48}$$
🎨 Color guide and visual structure
* Middle line (red): the main anchor of Bitcoin's fair value.
* Upper band (yellow): represents a 10% positive deviation above the fair line (macro resistance).
* Lower band (green): represents a 10% negative deviation below the fair line (macro support).
* Holographic line (bright white dotted): shows the current position of the fair value on the latest price bars.
* Background color (soft green): automatic activation of the deep buy zone (Buy Zone).
⚙️ Key features and settings
* 🌐 Support for 3 languages: the information table (HUD) can be localized into English**, **Persian and Kurdish (Kurdî).
* 🔮 Price target forecasts: the ability to manually enter expected price targets for the years 2026E**, **2030E and 2035E.
* 🟢 Dynamic buy zone: the ability to set a custom percentage for activating the macro buy zone (by default 18% below the green band).
* 📜 Historical touch tracker: automatic and smart recording of the years and prices at which Bitcoin hit the cycle bottom in the past.
📈 How to use it and the alert system
1. Generational buying opportunities: whenever the price falls below the green band (by the specified percentage), the chart background turns green and shows the best time for long-term accumulation.
2. Information table (HUD): in the top-right corner, it displays the live fair value, future price targets and the history of price bottoms.
3. Smart alert system: equipped with a native alert condition for the 🟢 Bitcoin BUY ZONE event, for quick notification to your mobile or browser when the price enters the buy zone.
The Kurdistani Bitcoin Power Law indicator is an advanced, long-term tool for the macro analysis of Bitcoin, developed with version 6 of Pine Script (Pine Script v6). This tool simulates the historical growth path of Bitcoin's price based on the mathematical “Power Law” model. In this model, time is treated as a logical, diminishing growth factor in order to prevent an unrealistic price explosion in the long run.
By plotting the “fair value” alongside deviation bands, this indicator helps investors identify tops, bottoms and long-term accumulation zones.
🔬 The model's mathematical calculations
This indicator calculates the number of days elapsed since Bitcoin's genesis block (January 3, 2009) and uses the following regression formula with an extremely high correlation coefficient ($R^2 = 0.9976$):
$$P(t) = 8.31 \times 10^{-17} \times t^{5.48}$$
🎨 Color guide and visual structure
* Middle line (red): the main anchor of Bitcoin's fair value.
* Upper band (yellow): represents a 10% positive deviation above the fair line (macro resistance).
* Lower band (green): represents a 10% negative deviation below the fair line (macro support).
* Holographic line (bright white dotted): shows the current position of the fair value on the latest price bars.
* Background color (soft green): automatic activation of the deep buy zone (Buy Zone).
⚙️ Key features and settings
* 🌐 Support for 3 languages: the information table (HUD) can be localized into English**, **Persian and Kurdish (Kurdî).
* 🔮 Price target forecasts: the ability to manually enter expected price targets for the years 2026E**, **2030E and 2035E.
* 🟢 Dynamic buy zone: the ability to set a custom percentage for activating the macro buy zone (by default 18% below the green band).
* 📜 Historical touch tracker: automatic and smart recording of the years and prices at which Bitcoin hit the cycle bottom in the past.
📈 How to use it and the alert system
1. Generational buying opportunities: whenever the price falls below the green band (by the specified percentage), the chart background turns green and shows the best time for long-term accumulation.
2. Information table (HUD): in the top-right corner, it displays the live fair value, future price targets and the history of price bottoms.
3. Smart alert system: equipped with a native alert condition for the 🟢 Bitcoin BUY ZONE event, for quick notification to your mobile or browser when the price enters the buy zone.
Persian original · View this post on Telegram ↗ · Open in the archive · 💬 Discuss in the Coin_Kurd Telegram group · Educational, not financial advice.