
🥇🔥 Gold in a 26-Year Mirror; Is September a Dangerous Month or a Golden Opportunity?
🥇🔥 Gold in a 26-Year Mirror; Is September a Dangerous Month or a Golden Opportunity?
🌍 Context | Complete Map of Gold's Historical Behavior
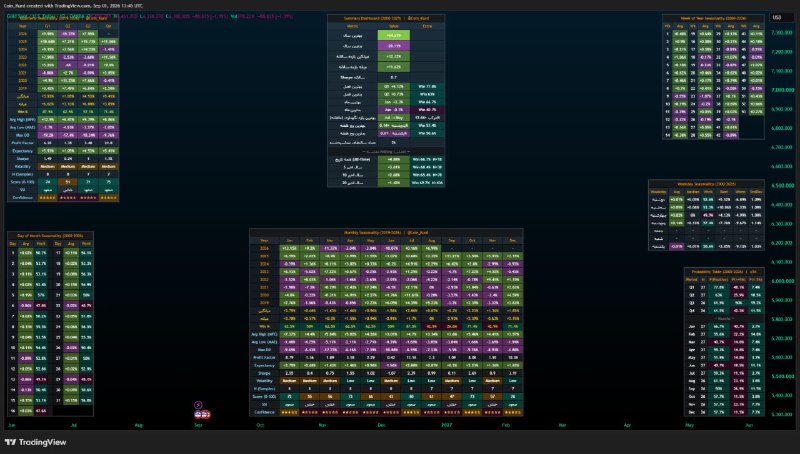
* 📊 The Gold Spot / USD chart in the image examines seasonal, monthly, weekly, and even daily performance over long-term periods. The recorded price at the moment of the image was around $4,354.95 and dropped 2.12% on the same day.
* 🏆 In the main panel, gold's best annual performance is recorded at +64.67% and the worst performance at -28.11%. The average seasonal performance is around +12.32% and the average of negative periods is around -11.62%; therefore, gold's long-term trend has been positive, but heavy drawdowns are also part of its historical behavior.
🎯 Focus | Season and Month; Where is the Winning Card?
* 🟢 The first quarter of the year (Q1) with an average of +14.12% has been the best historical season and was recorded as positive in 77.8% of cases. Q2 with an average of around +0.73% was the weakest season, although its win rate is still 63%.
* 📅 Among the months, January with an average of around +3.3% and a 66.7% probability of being positive is one of the strongest months. Conversely, June had an average of around -0.7% and only a 40.7% probability of being positive, showing the weakest monthly pattern.
* ⚠️ For September, the picture is completely different: the probability of being positive is around **50%**, the probability of a gain greater than 5% is around **26.9%**, and the probability of a drop greater than 5% is around 11.5%. This means September historically is more of a two-sided and unreliable month rather than a definitively bullish month.
📈 Implications | Hidden Details in Daily and Weekly Panels
* 🗓 In the day-of-month pattern**, many days have very small averages; as a result, a strong trading signal cannot be extracted solely based on a specific day. However, the probability of being positive for many days lies around **50 to 59%**; meaning the historical advantage of buyers is often subtle, not decisive.
* 📆 In the weeks of the year**, the 8th week with around **+0.7%** has the best average and the 6th week also recorded around +0.62%; in contrast, the 9th week with around -0.55% and the 12th week with -0.32% are among the weakest weeks.
* 🕰 The day-of-week pattern is much weaker: Thursday has an average of around +0.14% and the best performance, while Saturday was around -0.01%. Therefore, weekly Seasonality alone does not create a major trading edge.
🧠 Conclusion
Overall, this image carries an important message: Gold historically has a strong bullish bias, but now we are in September; a month with a success probability of nearly 50%, which requires combining decisions more with price trend, volume, and technical structure rather than purely Seasonality. 🔥📊
#Gold #XAUUSD #Technical_Analysis #Seasonality
🌍 Context | Complete Map of Gold's Historical Behavior
* 📊 The Gold Spot / USD chart in the image examines seasonal, monthly, weekly, and even daily performance over long-term periods. The recorded price at the moment of the image was around $4,354.95 and dropped 2.12% on the same day.
* 🏆 In the main panel, gold's best annual performance is recorded at +64.67% and the worst performance at -28.11%. The average seasonal performance is around +12.32% and the average of negative periods is around -11.62%; therefore, gold's long-term trend has been positive, but heavy drawdowns are also part of its historical behavior.
🎯 Focus | Season and Month; Where is the Winning Card?
* 🟢 The first quarter of the year (Q1) with an average of +14.12% has been the best historical season and was recorded as positive in 77.8% of cases. Q2 with an average of around +0.73% was the weakest season, although its win rate is still 63%.
* 📅 Among the months, January with an average of around +3.3% and a 66.7% probability of being positive is one of the strongest months. Conversely, June had an average of around -0.7% and only a 40.7% probability of being positive, showing the weakest monthly pattern.
* ⚠️ For September, the picture is completely different: the probability of being positive is around **50%**, the probability of a gain greater than 5% is around **26.9%**, and the probability of a drop greater than 5% is around 11.5%. This means September historically is more of a two-sided and unreliable month rather than a definitively bullish month.
📈 Implications | Hidden Details in Daily and Weekly Panels
* 🗓 In the day-of-month pattern**, many days have very small averages; as a result, a strong trading signal cannot be extracted solely based on a specific day. However, the probability of being positive for many days lies around **50 to 59%**; meaning the historical advantage of buyers is often subtle, not decisive.
* 📆 In the weeks of the year**, the 8th week with around **+0.7%** has the best average and the 6th week also recorded around +0.62%; in contrast, the 9th week with around -0.55% and the 12th week with -0.32% are among the weakest weeks.
* 🕰 The day-of-week pattern is much weaker: Thursday has an average of around +0.14% and the best performance, while Saturday was around -0.01%. Therefore, weekly Seasonality alone does not create a major trading edge.
🧠 Conclusion
Overall, this image carries an important message: Gold historically has a strong bullish bias, but now we are in September; a month with a success probability of nearly 50%, which requires combining decisions more with price trend, volume, and technical structure rather than purely Seasonality. 🔥📊
#Gold #XAUUSD #Technical_Analysis #Seasonality
Persian original · View this post on Telegram ↗ · Open in the archive · 💬 Discuss in the Coin_Kurd Telegram group · Educational, not financial advice.