
💸 September for Bitcoin: A Weak Month Before a Possible October Rally? 📊🔥
💸 September for Bitcoin: A Weak Month Before a Possible October Rally? 📊🔥
Background — The Market Big Picture and Historical Data
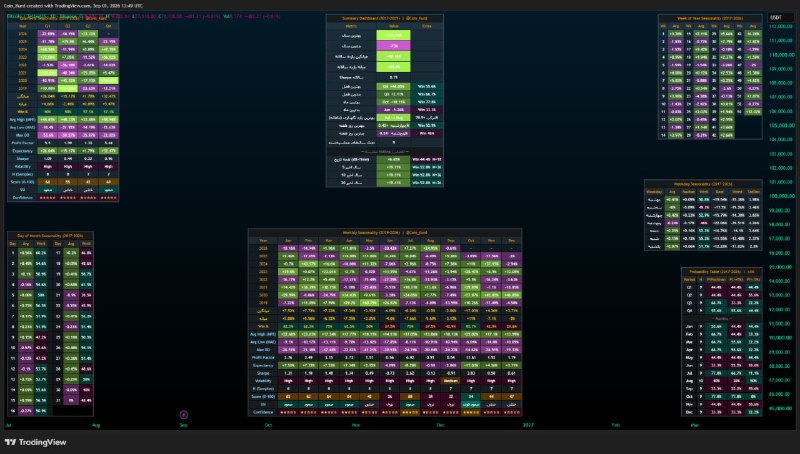
This “Coin_Kurd” dashboard examines Bitcoin's historical behavior using quarterly, monthly, weekly and day-of-month data. When the chart was captured, Bitcoin was trading around $78,000 and was down about 0.74% at that moment.
* In the main 2017–2025 dashboard, the best annual performance was +301.98% and the worst −73%; the average annual return is +90.16% and the median +94.4%.
* An annual Sharpe ratio of 0.71 shows historical returns have been high, but they should be interpreted cautiously against risk and volatility.
* Important note: different sections of the image cover different time ranges; some 2017–2026, some 2019–2026, and the main dashboard 2017–2025.
Focus — September: Bitcoin's Seasonal Weak Spot? 🔍
The image's most important message is September's historical weakness.
* 📉 September's average return in the monthly table is about −2.06%, and only 42.9% of Septembers were positive; historically, it is one of the weakest months.
* ⚠️ August, in the same table, has an average of −0.5% and a 37.5% success rate; so September begins after a period of weak seasonal strength.
* 🚀 October, by contrast, looks very different: a historical average of about +17.03% and an 85.7% success rate. The summary dashboard also shows October as the best month, with a +18.11% return.
This gap matters a lot: the data do not show that Bitcoin will “definitely” rise in October, but they do show that, historically, autumn's risk/reward has shifted sharply in October's favor.
Implications — Q4 Could Be Decisive 📈
* 🟢 In the main dashboard, the fourth quarter (Q4) was the best quarter, with a +44.05% return and a 55.6% probability of being positive; Q3, despite a 66.7% win rate, returned only about +2.11%. In other words, a high number of positive periods does not necessarily mean strong returns.
* 📊 Day-of-week data are also mostly positive. Weeks 43 (+6.24%) and 53 (+12.07%) are among the strongest weeks of the year; weeks 3, 5, 8, 33 and 47, by contrast, perform negatively.
* 🧭 In the monthly probability table, October, with a 77.8% positive probability in one metric and 77.8% in the other**, is one of the strongest points on the calendar; July, with **77.8% in the positive-probability column, also has strong historical performance. September, however, shows only a 33.3% positive probability in one of the metrics in the same table.
On the other hand, the monthly table shows June as the weakest month on average, at about −4.09%, with a Sharpe of −0.73; October, with a Sharpe of about 3.83 and a Profit Factor of about 31.61**, stands in a very different position historically.
Conclusion — The More Likely Scenario 🎯
Rather than giving a definitive buy signal, this image offers a **timing map: September is historically a risky, weak month, but if the market structure holds, October and Q4 as a whole are among Bitcoin's strongest seasonal windows; so September's weakness alone should not be mistaken for the start of a long-term downtrend. 📊₿
#Bitcoin #BTC #Technical_Analysis #CoinKurd
🔗Link
Background — The Market Big Picture and Historical Data
This “Coin_Kurd” dashboard examines Bitcoin's historical behavior using quarterly, monthly, weekly and day-of-month data. When the chart was captured, Bitcoin was trading around $78,000 and was down about 0.74% at that moment.
* In the main 2017–2025 dashboard, the best annual performance was +301.98% and the worst −73%; the average annual return is +90.16% and the median +94.4%.
* An annual Sharpe ratio of 0.71 shows historical returns have been high, but they should be interpreted cautiously against risk and volatility.
* Important note: different sections of the image cover different time ranges; some 2017–2026, some 2019–2026, and the main dashboard 2017–2025.
Focus — September: Bitcoin's Seasonal Weak Spot? 🔍
The image's most important message is September's historical weakness.
* 📉 September's average return in the monthly table is about −2.06%, and only 42.9% of Septembers were positive; historically, it is one of the weakest months.
* ⚠️ August, in the same table, has an average of −0.5% and a 37.5% success rate; so September begins after a period of weak seasonal strength.
* 🚀 October, by contrast, looks very different: a historical average of about +17.03% and an 85.7% success rate. The summary dashboard also shows October as the best month, with a +18.11% return.
This gap matters a lot: the data do not show that Bitcoin will “definitely” rise in October, but they do show that, historically, autumn's risk/reward has shifted sharply in October's favor.
Implications — Q4 Could Be Decisive 📈
* 🟢 In the main dashboard, the fourth quarter (Q4) was the best quarter, with a +44.05% return and a 55.6% probability of being positive; Q3, despite a 66.7% win rate, returned only about +2.11%. In other words, a high number of positive periods does not necessarily mean strong returns.
* 📊 Day-of-week data are also mostly positive. Weeks 43 (+6.24%) and 53 (+12.07%) are among the strongest weeks of the year; weeks 3, 5, 8, 33 and 47, by contrast, perform negatively.
* 🧭 In the monthly probability table, October, with a 77.8% positive probability in one metric and 77.8% in the other**, is one of the strongest points on the calendar; July, with **77.8% in the positive-probability column, also has strong historical performance. September, however, shows only a 33.3% positive probability in one of the metrics in the same table.
On the other hand, the monthly table shows June as the weakest month on average, at about −4.09%, with a Sharpe of −0.73; October, with a Sharpe of about 3.83 and a Profit Factor of about 31.61**, stands in a very different position historically.
Conclusion — The More Likely Scenario 🎯
Rather than giving a definitive buy signal, this image offers a **timing map: September is historically a risky, weak month, but if the market structure holds, October and Q4 as a whole are among Bitcoin's strongest seasonal windows; so September's weakness alone should not be mistaken for the start of a long-term downtrend. 📊₿
#Bitcoin #BTC #Technical_Analysis #CoinKurd
🔗Link
Persian original · View this post on Telegram ↗ · Open in the archive · 💬 Discuss in the Coin_Kurd Telegram group · Educational, not financial advice.