
Complete Analysis of Bitcoin Seasonality 2009 to 2026 | Precise Data
📊
Complete Analysis of Bitcoin Seasonality 2009 to 2026 | Precise Data
@Coin_Kurd
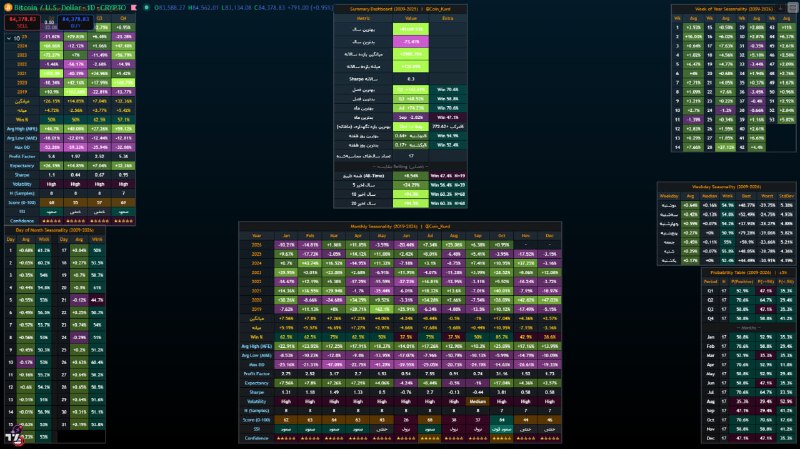
From 2009 to 2026, Bitcoin has shown one of the strongest seasonal patterns in the financial markets. According to the summary dashboard, the best year had an incredible positive return of 41,669.93 percent, while the worst year came with a 73.41 percent decline. The average annual return reached 2,985.95 percent and the median annual return reached 120.89 percent. The annual Sharpe ratio was calculated at 0.3, indicating high returns relative to risk.
In the quarterly section, the second quarter (Q2), with a return of 143.61 percent and a win rate of 70.6 percent, has been the best quarter historically, and the third quarter (Q3), with 68.52 percent, comes next. The best month is July, with a 74.23 percent return and a 70.6 percent win rate, and the worst month is September, with a 2.82 percent decline and a 47.1 percent win rate. The strongest monthly holding period has been from October to August, with a compound return of over 772.62 percent. Monday has been identified as the best day of the week with a 54.9 percent win rate and Sunday the worst with 52.4 percent. The number of years calculated is 17.
In the rolling quarterly comparison, the all-time return was 8.54 percent with a 47.4 percent win rate (19 samples), the last five years 24.29 percent with a 56.4 percent win rate (39 samples), and the last ten and twenty years both 94.9 percent with a 60.3 percent win rate (68 samples).
The probability table with a 5 percent margin shows that the second quarter is the strongest quarter, with a 70.6 percent probability of being positive, a 64.7 percent probability of exceeding 5 percent, and a 29.4 percent probability of being negative by more than 5 percent. Among the months, October leads, with probabilities of being positive and of exceeding 5 percent both at 70.6 percent and a negative probability of only 17.6 percent. April, February and July are also very strong. August is the weakest month, with a 35.3 percent probability of being positive and a 52.9 percent probability of being negative. September and December have also performed poorly.
In the week-of-year seasonality, weeks 28 with 37.12 percent, 2 with 16.03 percent and 43 with 11 percent have been among the strongest. The days of the month also show that days 20 and 26 have relatively better returns. Among the days of the week, Monday and Friday have higher average returns than Sunday.
Monthly data from 2019 to 2026 confirms that October, with an average of 17.04 percent and a win rate of 85.7 percent, has been the strongest month, and June, August and September the weakest months. These patterns can be useful for planning medium-term entries and exits, although market risk is always present.
#Bitcoin #BitcoinSeasonality #Crypto #Technical_Analysis
Complete Analysis of Bitcoin Seasonality 2009 to 2026 | Precise Data
@Coin_Kurd
From 2009 to 2026, Bitcoin has shown one of the strongest seasonal patterns in the financial markets. According to the summary dashboard, the best year had an incredible positive return of 41,669.93 percent, while the worst year came with a 73.41 percent decline. The average annual return reached 2,985.95 percent and the median annual return reached 120.89 percent. The annual Sharpe ratio was calculated at 0.3, indicating high returns relative to risk.
In the quarterly section, the second quarter (Q2), with a return of 143.61 percent and a win rate of 70.6 percent, has been the best quarter historically, and the third quarter (Q3), with 68.52 percent, comes next. The best month is July, with a 74.23 percent return and a 70.6 percent win rate, and the worst month is September, with a 2.82 percent decline and a 47.1 percent win rate. The strongest monthly holding period has been from October to August, with a compound return of over 772.62 percent. Monday has been identified as the best day of the week with a 54.9 percent win rate and Sunday the worst with 52.4 percent. The number of years calculated is 17.
In the rolling quarterly comparison, the all-time return was 8.54 percent with a 47.4 percent win rate (19 samples), the last five years 24.29 percent with a 56.4 percent win rate (39 samples), and the last ten and twenty years both 94.9 percent with a 60.3 percent win rate (68 samples).
The probability table with a 5 percent margin shows that the second quarter is the strongest quarter, with a 70.6 percent probability of being positive, a 64.7 percent probability of exceeding 5 percent, and a 29.4 percent probability of being negative by more than 5 percent. Among the months, October leads, with probabilities of being positive and of exceeding 5 percent both at 70.6 percent and a negative probability of only 17.6 percent. April, February and July are also very strong. August is the weakest month, with a 35.3 percent probability of being positive and a 52.9 percent probability of being negative. September and December have also performed poorly.
In the week-of-year seasonality, weeks 28 with 37.12 percent, 2 with 16.03 percent and 43 with 11 percent have been among the strongest. The days of the month also show that days 20 and 26 have relatively better returns. Among the days of the week, Monday and Friday have higher average returns than Sunday.
Monthly data from 2019 to 2026 confirms that October, with an average of 17.04 percent and a win rate of 85.7 percent, has been the strongest month, and June, August and September the weakest months. These patterns can be useful for planning medium-term entries and exits, although market risk is always present.
#Bitcoin #BitcoinSeasonality #Crypto #Technical_Analysis
Persian original · View this post on Telegram ↗ · Open in the archive · 💬 Discuss in the Coin_Kurd Telegram group · Educational, not financial advice.