
📊 Detailed Analysis of the Bitcoin Chart (BTC/USD - Daily Timeframe)
🕯
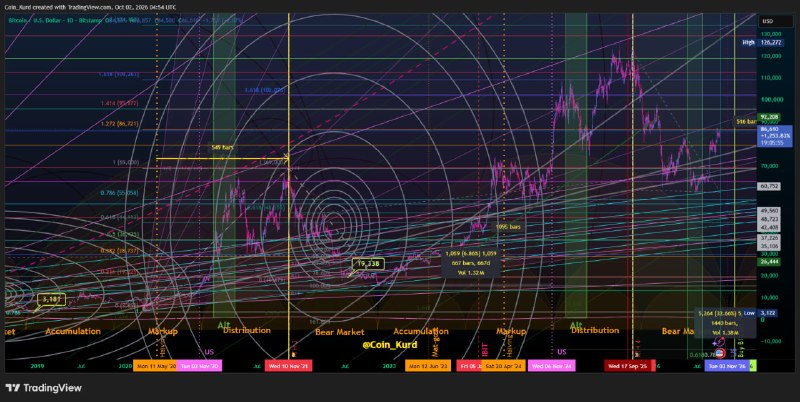
📊 Detailed Analysis of the Bitcoin Chart (BTC/USD - Daily Timeframe)
Chart date: October 2, 2026 | Current price ≈
$86,651
(+2.12%)
💰 1. Overall Cycle Structure
The chart is drawn based on the Wyckoff + Halving model. The phases are as follows:
-
Accumulation
(2019 to early 2020): bottoming before Halving 3
-
Markup
(2020–2021): the main rally after Halving 3
-
Alt Distribution
(late 2021): secondary distribution
-
Bear Market
(2022): bear market
-
Accumulation
(2023): bottoming after the November low
-
Markup 4
(2024 to mid-2025): the rally after Halving 4
-
Alt Distribution
(mid to late 2025): secondary distribution after the top
- The chart now clearly shows that the bearish phase has ended and the market is building one of its strongest supports
🔥 2. Key Fibonacci Levels and Support/Resistance
Important resistances above the price:
- 86,721 ← 1.272 (nearest resistance)
- 92,208 ← important level
- 98,972 ← 1.414
- 102,070 and 109,263 ← 1.618
- All-time high: 126,272
🚀 Important supports below the price:
- 69,000 ← the 1.0 level (strong yellow line)
- 60,752
- 55,058 ← 0.786
- 48,723 – 49,560 (high-density zone)
- 42,408 – 37,226
- 26,444 (long-term support)
The market has given you its last chance below the
1.272
Fibonacci level at
$86,721
. We hope you made use of it
✅ 3. Spirals and Trendlines
Several Fibonacci Spirals and Logarithmic Spirals have been drawn from the 2019, 2020 and 2022 lows. The price is now sitting exactly on one of the main arms of the central spiral, and this zone is turning into one of the strongest supports on the chart.
A large number of ascending and descending trendlines converge in the 85–92 thousand zone, which has made this area a very important decision zone.
4. Volume and Momentum
High volume was recorded in the 19,338 zone (the 2022 low). In the recent move, volume of 1.32 million is seen in a single candle, indicating good activity. The recent candles show buyers' efforts to hold the 85–87 thousand level.
5. Possible Scenarios
Main scenario (based on the chart):
The chart clearly shows that the bear market has ended and is building one of its strongest supports. If the price consolidates above 86,721, a move toward 92,200 and then 98–102 thousand will be very likely and strong
📈 Alternative scenario:
Only in the event of a decisive break below 84,500 could lower levels come into view, but for now the chart shows this probability as weak.
Summary and Key Note
This is a copy of my analysis chart. With it, you can see where and why the main resistances and supports lie on the Bitcoin market on the daily timeframe. Save this link
📌 🔗
https://www.tradingview.com/chart/onUe3aWi/
The market has given you its last chance below the 1.272 Fibonacci level at $86,721. We hope you made use of it. The chart clearly shows the bear market has ended and is building one of its strongest supports
🔥
📊 Detailed Analysis of the Bitcoin Chart (BTC/USD - Daily Timeframe)
Chart date: October 2, 2026 | Current price ≈
$86,651
(+2.12%)
💰 1. Overall Cycle Structure
The chart is drawn based on the Wyckoff + Halving model. The phases are as follows:
-
Accumulation
(2019 to early 2020): bottoming before Halving 3
-
Markup
(2020–2021): the main rally after Halving 3
-
Alt Distribution
(late 2021): secondary distribution
-
Bear Market
(2022): bear market
-
Accumulation
(2023): bottoming after the November low
-
Markup 4
(2024 to mid-2025): the rally after Halving 4
-
Alt Distribution
(mid to late 2025): secondary distribution after the top
- The chart now clearly shows that the bearish phase has ended and the market is building one of its strongest supports
🔥 2. Key Fibonacci Levels and Support/Resistance
Important resistances above the price:
- 86,721 ← 1.272 (nearest resistance)
- 92,208 ← important level
- 98,972 ← 1.414
- 102,070 and 109,263 ← 1.618
- All-time high: 126,272
🚀 Important supports below the price:
- 69,000 ← the 1.0 level (strong yellow line)
- 60,752
- 55,058 ← 0.786
- 48,723 – 49,560 (high-density zone)
- 42,408 – 37,226
- 26,444 (long-term support)
The market has given you its last chance below the
1.272
Fibonacci level at
$86,721
. We hope you made use of it
✅ 3. Spirals and Trendlines
Several Fibonacci Spirals and Logarithmic Spirals have been drawn from the 2019, 2020 and 2022 lows. The price is now sitting exactly on one of the main arms of the central spiral, and this zone is turning into one of the strongest supports on the chart.
A large number of ascending and descending trendlines converge in the 85–92 thousand zone, which has made this area a very important decision zone.
4. Volume and Momentum
High volume was recorded in the 19,338 zone (the 2022 low). In the recent move, volume of 1.32 million is seen in a single candle, indicating good activity. The recent candles show buyers' efforts to hold the 85–87 thousand level.
5. Possible Scenarios
Main scenario (based on the chart):
The chart clearly shows that the bear market has ended and is building one of its strongest supports. If the price consolidates above 86,721, a move toward 92,200 and then 98–102 thousand will be very likely and strong
📈 Alternative scenario:
Only in the event of a decisive break below 84,500 could lower levels come into view, but for now the chart shows this probability as weak.
Summary and Key Note
This is a copy of my analysis chart. With it, you can see where and why the main resistances and supports lie on the Bitcoin market on the daily timeframe. Save this link
📌 🔗
https://www.tradingview.com/chart/onUe3aWi/
The market has given you its last chance below the 1.272 Fibonacci level at $86,721. We hope you made use of it. The chart clearly shows the bear market has ended and is building one of its strongest supports
🔥
Persian original · View this post on Telegram ↗ · Open in the archive · 💬 Discuss in the Coin_Kurd Telegram group · Educational, not financial advice.